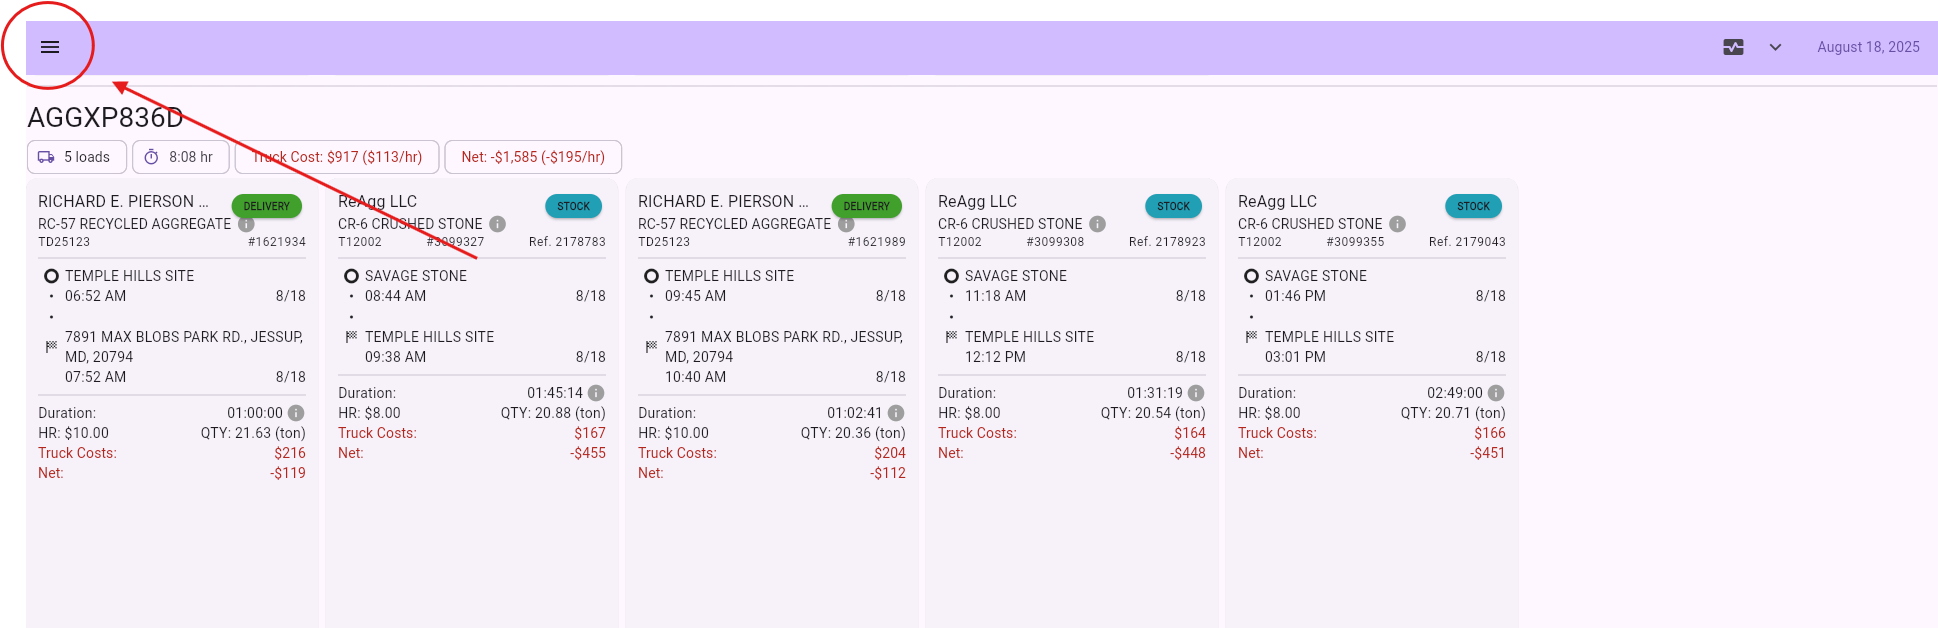
Summary reports can be found in the app drawer:
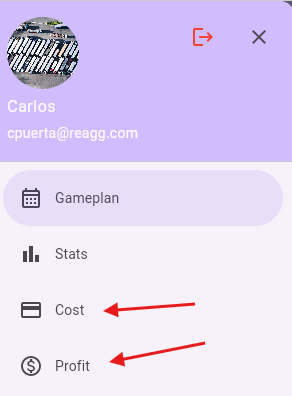
These reports summarize all of the information in the Gameplan view based on the filters being used. See Filters.
Cost Report
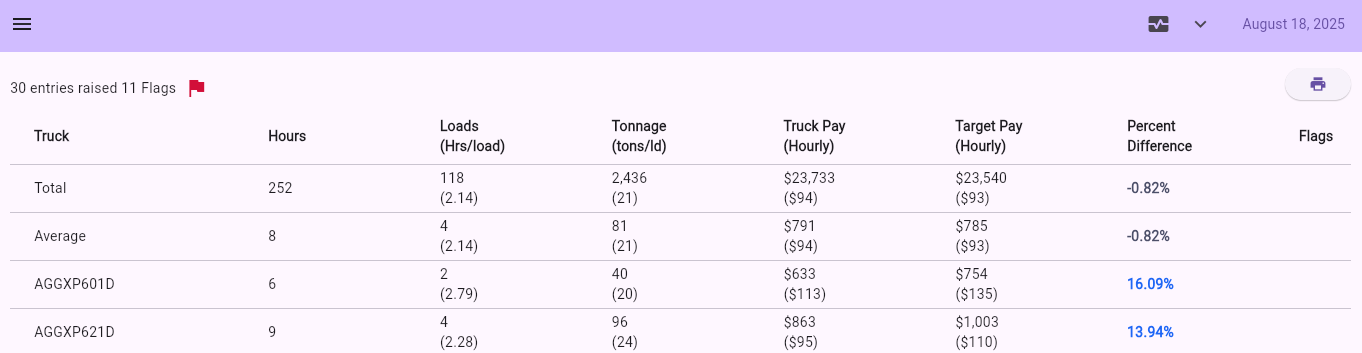
Columns
- Name - Name of item being summarized. Can be truck, hauler, job, or salesperson name.
- Hours - Number of hours worked in timeframe
- Loads (Hr/Load) - Number of loads (not tickets) completed in timeframe. The number in parenthesis is the average number of hours it took to complete a single load.
- Tonnage (tons/ld) - Total tonnage for time frame. Number in parenthesis is the average tons per load.
- Truck pay (Hourly) - Total amount that was paid. Number in parenthesis is the hourly rate.
- Target pay (Hourly) - Total amount that should have been paid. Number in parenthesis is the targeted hourly rate.
- Percent Difference - How far apart the Actual and Target Pays are.
- Flags - Whether any of the tickets are flagged. A red flag means that the flags in the tickets can potentially influence the report being shown.
Profit Report
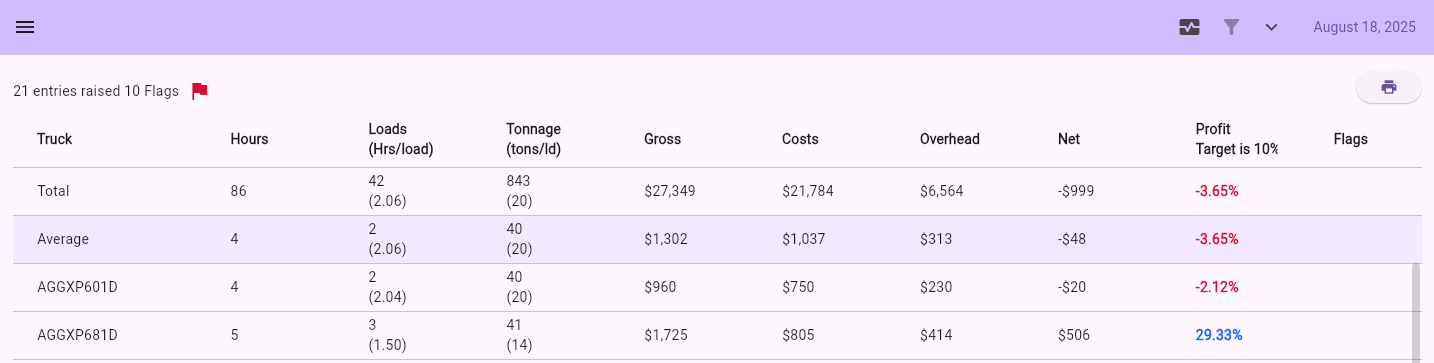
Columns
- Name - Name of item being summarized. Can be truck, hauler, job, or salesperson name.
- Hours - Number of hours worked in timeframe
- Loads (Hr/Load) - Number of loads (not tickets) completed in timeframe. The number in parenthesis is the average number of hours it took to complete a single load.
- Tonnage (tons/ld) - Total tonnage for time frame. Number in parenthesis is the average tons per load.
- Gross - Total amount that was billed.
- Costs - Estimated costs (includes material/service and haul).
- Overhead - Estimated overhead.
- Net - .
- Profit -
- Flags - Whether any of the tickets are flagged. A red flag means that the flags in the tickets can potentially influence the report being shown.